November 2016 Nanaimo Real Estate Market Stats
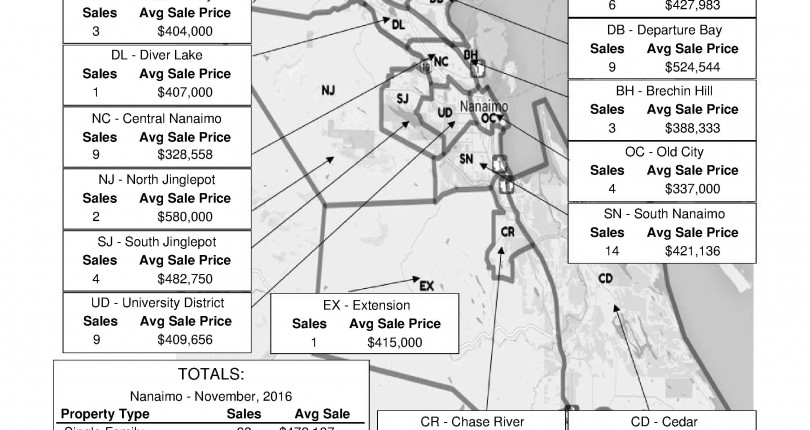
Single-family homes for sale in Nanaimo area dropped yet again in November 2016 to reach a new historic low of 1,034, a 37 per cent decrease from one year ago and dipping below October’s 1,158 available listings. Sales of single-family homes in November decreased by 13 per cent from October 2016, but remained flat year over year, with 347 homes selling last month compared to 349 in November 2015. While the Foreign Buyer Tax imposed at the beginning of August has adversely affected the Vancouver market, there appears to be no negative fallout thus far in the Vancouver Island Real Estate Board area. The latter restrictions, intended to standardize eligibility criteria for high-ratio and low-ratio insured mortgages, will have a greater impact on buyers purchasing homes in the $500,000-plus range. Nanaimo’s benchmark price rose 22 per cent to $433,700 while the Parksville-Qualicum area saw its benchmark price rise by 19 per cent to $452,600.
![]()