July 2016 Nanaimo Real Estate Market Stats
Home sales in Nanaimo area cooled somewhat last month but posted a 19 per cent increase over July 2015. In July 2016, 608 sold compared to 512 last July. Last month’s active listings for single-family homes totaled 1,577, down 34 per cent from the 2,391 reported in July 2015 and beating June’s figure of 1,621. The last time inventory was this low occurred in 2005 when the number of single-family homes for sale dropped.
“The housing market is usually slower in the summer months, but we believe that sales might be beginning to normalize,” says Cameron Muir, BCREA Chief Economist. “If so, that would allow inventory to build up and ease pricing pressure a bit.”
Market Stats for Nanaimo
Low inventory is also contributing to rising benchmark prices for single-family homes, townhouses, and apartments. Despite those increases, however, the Nanaimo housing market continues to be affordable compared to the Lower Mainland and Victoria.
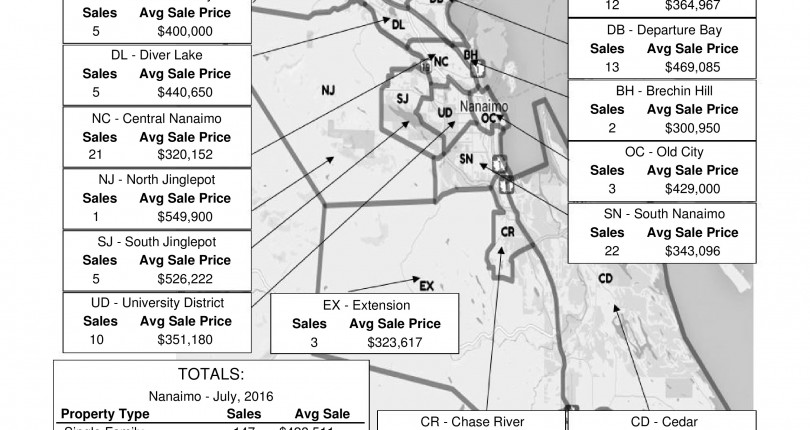
For now, the housing market remains competitive, so connecting with a local REALTOR® is crucial to ensure you develop a winning strategy for buying or selling your home. Here is a map showing you the average sale price of homes for different areas in Nanaimo.
View Feature Properties Contact Scott